Friday, November 30, 2012

Friday (Off) Topic - Burning Platform


A long held strategy for dealing with institutional resistance to change is: Create a Burning Platform.  

The idea is: People resist change.  Staying where they are is generally easier than moving from the status quo.

burning platform is a way to challenge people.  In business it says a market, product or way of doing things has evolved to the point such that staying where you are is the least comfortable place to be.  When a platform becomes hot enough,  it is easier to jump or embrace change than live with the status quo.

Established businesses often land on burning platforms. Newspapers, travel agents, libraries, print magazines, and broadcast television have all had to "jump" to meet the challenges of their changing markets.

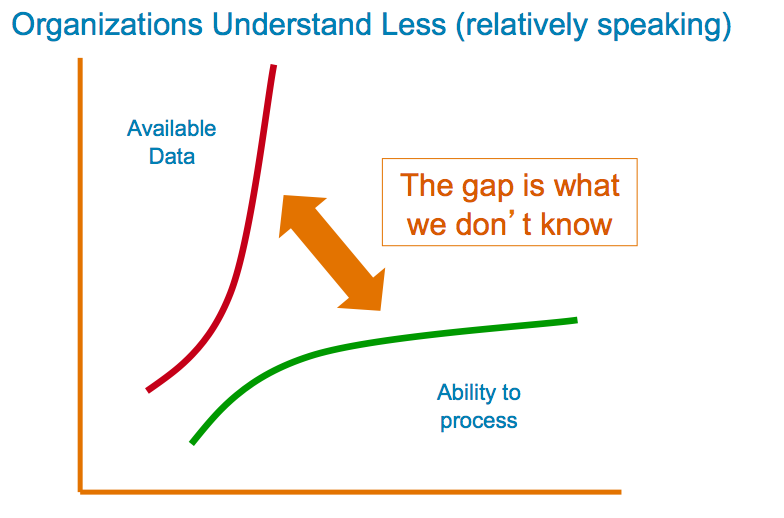
Big data creates a large number of burning platforms. We will review many of them in the weeks to come. In the meantime, consider defining you own burning platforms to institute change around you.

Bonus Tip #1

Here's a burning platform that exists in most organizations:
 
    "If we don't do this now, then <insert competitor name here> will!

This line of reasoning motivates colleagues just about every time - and is often true more frequently than that.

Wednesday, November 28, 2012

Volume Strategies

**** Looking BACK to 2012 ****


Working with large data volumes is never easy.  Here are three strategies that can help you.
  1. Keep your eye on context. Where data comes from, who produced it and when it was created are examples of attributes that assist many types of analysis. Traditional Extract Transfer and Load (ETL) systems take pride in their ability to remove some of these noisy attributes. But any data attribute could eventually be the key to unlocking hidden data correlations. Adding data as you process incoming streams should be expected.
  2. Some attributes are better than others! Time and location are examples of broad filters that can be used to reduce datasets to more manageable numbers that can be subsequently analyzed deeper than is possible across a larger domain. In terms of volume, think reduce first with broad filters and then apply deep analysis with as many attributes as you can tolerate.
  3. Big data analysis gets better the more you work it. You start with a good hypothesis. By retesting your analysis with both supporting and conflicting data, you arrive at a more complete solution.
Let's look at a very simple example that pulls all these ideas together.

You look at a set of customer feedback comments. Attributes include rating, date, product, comments, and author name. Assume you have many hundreds of thousands of items and you are keeping all attributes.

  • The first filter you apply is by date to remove comments about obsolete products. This reduces your data to thousands of items. A good broad filter gets you down to workable datasets fast.\
  • You look at low ratings first. Scanning product names and author, you see a rather wide range. But on a hunch, you sort comment text. You see 700 comments are the same (you use a Baysian filter to filter text that is identical with minor differences). You identified an adhoc discriminator: identical comments from different people about different products likely come from the same source and need to be discounted.
  • Finally you look at the referenced product name. You apply a simple text extractor to look for product names you care about. A comparison of remaining items shows that 50% of comments refer to products that differ from the product name attribute associated with the text. You quickly infer that there could be a problem with the ETL process.  This simple revisiting of data shows how your ETL may need some work.  
Just remember: this scenario is simple. More tools and techniques are needed to work with large datasets.  

Stay tuned :)


Tuesday, November 27, 2012

Closing the Understanding Gap


**** Looking BACK to 2012 ****


Yesterday I showed how our ability to understand new sources of data is being hampered by lack of programming and analysis resources.  Today, we start looking at solutions to close the understanding gap.


Borrowing from my colleagues who work with artificial intelligence and machine learning, we see a set of curves that are remarkably similar to those shown previously to contrast the growth of data with our ability to process it.

Consider the effort required to successively correlate data when you have correct (green) versus different or conflicting attributes (red).  It becomes easier to confirm you have the same entity as you successively acquire more consistent and correct attributes.  This type of logical funnelling occurs as the number of attribute variations ultimately converge. Consider a web search for an old acquaintance. Compare the search results for their name alone and then after you add keyword terms like city and employer. You can often zero in on an answer that is consistent and correct in a few clicks.

With incorrect attributes, the opposite behavior is common. Conflicting attributes (or no attributes!)  lead you to successively higher numbers of conflicting elements. Think of a web search for 'bill smith'.  What's the likelihood you will use the "I'm feeling lucky" button?  

Banks rely on this "incorrect assertion" behaviour when they ask you security questions like "where were you born?", "what's your mother's maiden name?" and "when did you graduate university".  They assume a Google search will yield conflicting results for any person's name.  Further drilling on attributes will lead to more inconsistent attributes that are not easily resolved.

BIG DATA AFFINITY TIP #1

Get it right early!  When associating data elements by key, name or other semantic attribute, investing in a disambiguation algorithm that gets a better answer early, will significantly reduce the amount of processing and increase the likelihood of converging to a correct result.

Monday, November 26, 2012

More Data Solved with More Processing


**** Looking BACK to 2012 ****

Let's start digging into big data by examining some myths that can impede early adopters.


A common belief from people with a technical background: More data can be handled by simply using more processors and programs.  That's scalability!

But let's look a bit closer at data growth patterns with respect to the resources we typically have.


We have an intuitive understanding how data continues to accumulate at near exponential rates (the red curve above).  Please insert your favorite big data volume statistic here.

A sad reality: The number of programmers, developers and analysts is not growing anywhere near as fast (shown by the green curve above)!

Our ability to comprehend information is the gap between both curves. The shocking truth: Our understanding is actually shrinking relative to the amount of data available.  Or in other words,  organizations potentially understand less than they used to - and less than many of us expect.

Tomorrow: We'll discuss a key strategy for bridging this ever growing knowledge gap.


Friday, November 23, 2012

Friday (Off) Topic - Shorter Takes Longer


"If you want me to speak for an hour, I can start now.  If you want me to talk for five minutes, it will take awhile"  -- Paraphrased from Winston Churchill, UK Prime Minister WWII 

I believe we are losing the art of public speaking.  Web conferencing and PowerPoint are the unintended weapons in this battle. "Let's have a quick one hour meeting (where I will read you my slides)".  Is your head hurting yet?

You know the drill: You can read slides as well as the presenter.  So... What do you do? You work on your next presentation or read email while the presenter drones on with virtually no one listening.  On a one hour call with many 'listeners', the lost productivity is immense.

Contrast this scenario with a good TED talk.  20 minutes maximum and EVERYONE gets it.  You may not agree with the speaker but you remember just about everything that was said.  Can you really say that about your last 60 minute teleconference?

Here are my 4 simple tips for better presentations: 
  1. Tell a story.  Have an introduction, body and compelling ending. People notice when you take them on a journey that ends with a thought provoking conclusion.
  2. Don't just read your slides.  It puts everyone to sleep and gets them doing other things rather than paying attention to you. The best way to avoid this trap: don't make your slides into a document.  Some people will complain because they will be forced to listen. But I think that's a good thing.
  3. Engage your audience.  Ask questions, tell stories and add commentary that is specific to your listeners Don't change your slides. Just talk about specifics that your audience is interested in.
  4. Be responsible.  A 1 hour presentation to 40 people consumes one week of collective time!  Preparing and presenting good content is one of the best ways to get maximum return on this investment of human capital.  The common time slot is often an hour. Try using half that. Trust me. No one will complain that you finished early with a compelling and concise presentation.  In fact, they will love you for it! 
-------------

About Friday (Off) Topics: To celebrate TGIF, I dedicate Fridays to random topics that I hope you are interested in.

Thursday, November 22, 2012

Big Data Types

**** Looking BACK to 2012 ****


We intuitively know Big Data is about new datasources.  It is data that comes from new places, in many formats.

Here are the types of information often mentioned:
  • Transactional - HIGH VOLUME operational data often in its pre-warehoused state.  This data runs the business but doesn't necessarily rollup into summary form without a fair bit of help (i.e., lots of cleansing, normalizing and correlating)
  • Machine Data - FAST MOVING real-time data from automated sources.  Often very messy.  Can be difficult to relate to warehouse data without plenty of extra semantic muscle.
  • Social Data - The INFINITELY VARIABLE source of all knowledge - and the often source of nothing at all.  Finding the relevant needles in this giant haystack is challenging.
  • Enterprise - THE VALUABLE STUFF THAT RUNS YOUR BUSINESS.  Many of my colleagues say this data has 'veracity'.  I just say, 'This is the data that business trusts'.  
Next week I want to start talking about data volume, velocity, variety, and value.  I'll explode a few myths - and have some fun too.

Tomorrow with be (Off) Topic Friday - where I raise an unrelated but hopefully enlightening topic to celebrate TGIF.


Wednesday, November 21, 2012

What You Know + What You Need

**** Looking BACK to 2012 ****


SmarterData is about associating the data you know and trust with the wide range of other sources available outside your current line of business. Finding alternate sources is not very difficult. Cutting through the noise to get the best correlation with the data you trust, is the hard part.

Be prepared to do a couple of things:
  • Iterate. Iterate. Iterate. Your first try is never your best.  Expect to learn as you go.
  • Understand the value of your existing data. Curated, IT-cleansed data is sometimes hard to get. Yet it tends to reflect how your business is run.

    If your product delivery times are slow, your IT reports will likely have an associated metric. If your customers are unhappy about it, you will often need to look outside your current data sources to find out in a timely manner.

    Don't wait for your IT reports to show dissatisfaction through a lower sales metric.  Find out now, so you can do something about it. 

Tuesday, November 20, 2012

Welcome to SmarterData


**** Looking BACK to 2012 ****


I am unusually excited about Big Data. It is not your father's SQL. Big Data will revolutionize the way we use Business Analytics and do reporting.

We had an old adage in the Business Intelligence world. We claimed that data warehouses provided the "single version of the truth". I have always been a little uncomfortable with assertion. Today we are being to learn how naive that ideal was.

Fast forward to 2012. I want to show how Big Data helps you find the "most widely supported version of the truth".  That sounds a whole lot more convincing.

Over the next little while, I will share thoughts and insights that you won't find anywhere else.  Let's see if we can change the world, one large dataset at a time.